
FinOps in Databricks and Snowflake: Keys to Curbing Compute Overspend

Where the money goes on a cloud data platform, and which concrete rules curb it without slowing the business down
Quick Answer
Overspend in Databricks and Snowflake is almost never down to the platform being expensive, but to how it is used: compute left running with no work, resources larger than needed, queries that read far more than they need to and processes that repeat the same work every day.
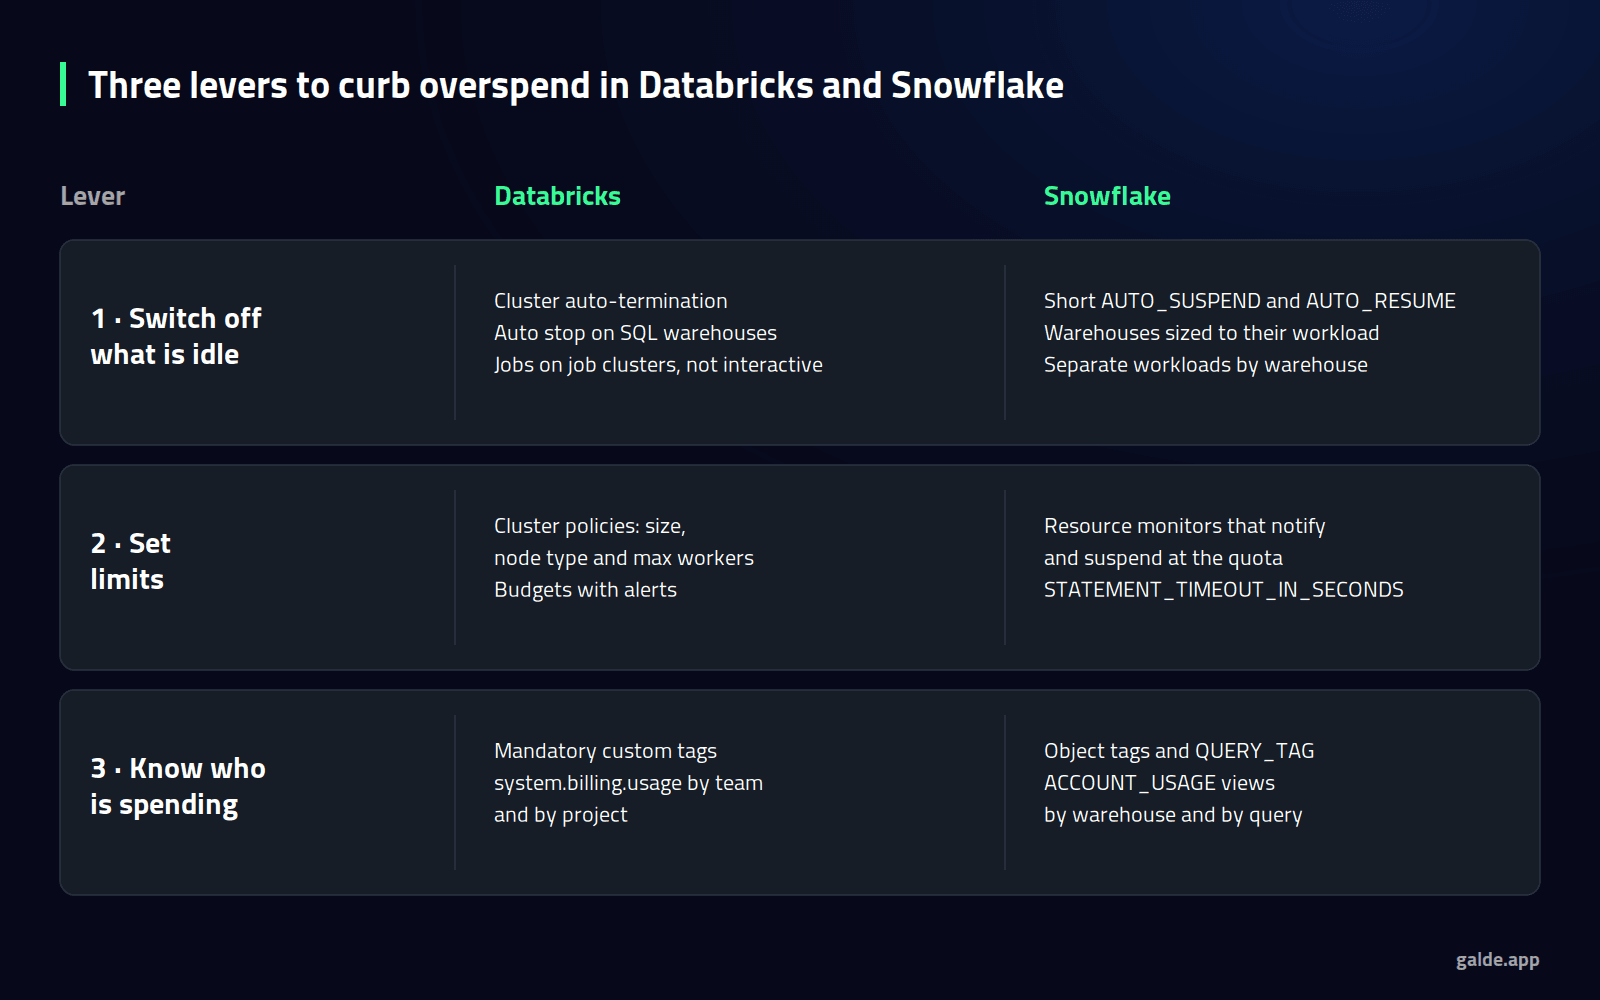
It is curbed with three levers: automatically switching off what is not in use, with cluster auto-termination and warehouse AUTO_SUSPEND; setting consumption limits, with cluster policies, resource monitors, budgets and query timeouts; and attributing every cost to its team through tags, so that whoever generates the cost can see it.
FinOps is not a one-off savings project but a habit: measure, optimise and operate with rules that enforce themselves.
On a cloud data platform, you do not pay for what you use: you pay for what you leave running.
The promise of the cloud is to pay only for what you consume. In practice, modern data platforms bill for compute time switched on, measured in DBUs in Databricks and in credits in Snowflake, and that time soars through small decisions nobody reviews: an interactive cluster someone left open on Friday, a large warehouse created for a one-off load that stayed forever, or a dashboard that refreshes every five minutes even though nobody looks at it overnight.
When the bill arrives, finance asks why it has grown, and the data team cannot say precisely which team, which process or which query made it grow.
The compute bill is neither a technical nor a financial problem: it is a visibility problem. Nobody optimises what they cannot see.
Why Costs Soar on Cloud Data Platforms
Elasticity works both ways. Creating a cluster or a warehouse takes seconds and needs no approval, so any team can increase spend without realising. And because consumption is spread across many users, processes and tools, nobody feels the total as their own. The result is predictable: cost grows faster than the value the platform generates.
The Five Usual Sources of Overspend
- Compute running with no work: interactive clusters nobody switches off and warehouses with long suspension times that keep consuming between queries.
- Oversized resources: a large warehouse for queries that fit in a small one, or clusters with a maximum number of workers far above what the workload needs.
- Inefficient queries: full table reads for lack of filters, partitioning or clustering,
SELECT *over wide tables and joins that multiply rows. - Redundant processing: full daily reloads where an incremental load would do, several teams computing the same thing in different pipelines and dashboards that refresh far more than necessary.
- Mixed workloads: heavy ETL and BI queries on the same cluster or warehouse, which forces everything to be sized for the peak.
The Three Levers for Curbing Spend
Almost all sustainable savings come from three levers that exist in both Databricks and Snowflake, albeit under different names.
Lever 1: Switch Off What Is Not in Use
In Databricks
- Auto-termination on every interactive cluster: an idle cluster should shut itself down in minutes, not hours.
- Job clusters for scheduled processes: jobs should run on job clusters, which are created and destroyed with each run and have a lower DBU rate than all-purpose clusters.
- Auto stop on SQL warehouses, tuned to each team's actual usage pattern.
In Snowflake
- Short
AUTO_SUSPENDandAUTO_RESUMEenabled: the warehouse suspends when it runs out of work and resumes by itself with the next query. - Size matched to the workload: start small and scale up only if queries queue or miss their target time.
- Separate workloads by warehouse: one for ETL and another for BI, each with its own size and suspension time.
ALTER WAREHOUSE bi_wh SET
  AUTO_SUSPEND = 60      -- seconds of inactivity before suspending
  AUTO_RESUME = TRUE;
One nuance: Snowflake bills a minimum of 60 seconds every time a warehouse starts, and suspending it discards its local cache. On BI warehouses with frequent queries, suspending too quickly can cost more than it saves; the optimal time depends on each workload's usage pattern.
Lever 2: Set Consumption Limits
In Databricks: Cluster Policies and Budgets
Cluster policies define what each team can create: allowed node types, maximum size, auto-termination time and mandatory tags. That way, savings do not depend on every user configuring their cluster correctly.
{
  "autotermination_minutes": { "type": "range", "maxValue": 30, "defaultValue": 20 },
  "autoscale.max_workers": { "type": "range", "maxValue": 8 },
  "custom_tags.cost_centre": { "type": "unlimited", "isOptional": false }
}
With this policy, no cluster can stay running for more than 30 minutes without activity or grow beyond 8 workers, and none can be created without its cost centre. At account level, budgets send alerts when a team's or project's spend approaches what was planned.
In Snowflake: Resource Monitors, Budgets and Timeouts
Resource monitors set a credit quota per period and act when it is reached: notify, suspend the warehouse once running queries finish, or suspend it immediately.
CREATE RESOURCE MONITOR rm_analytics WITH
  CREDIT_QUOTA = 500
  FREQUENCY = MONTHLY
  START_TIMESTAMP = IMMEDIATELY
  TRIGGERS ON 80 PERCENT DO NOTIFY
           ON 100 PERCENT DO SUSPEND
           ON 110 PERCENT DO SUSPEND_IMMEDIATE;

ALTER WAREHOUSE bi_wh SET RESOURCE_MONITOR = rm_analytics;
Resource monitors cover warehouses. For serverless services, Snowflake offers budgets with alerts. And the STATEMENT_TIMEOUT_IN_SECONDS parameter cancels any query that exceeds a reasonable maximum time for its warehouse, before a badly written query burns credits for hours.
Lever 3: Know Who Is Spending
Without attribution, cost belongs to everyone and therefore to no one. The goal is for every euro of compute to belong to a team, a project or a data product.
- In Databricks, the tags on clusters and warehouses, the
custom_tags, flow into thesystem.billing.usagesystem table, which lets you aggregate consumption by cost centre, team or project. - In Snowflake, object tags assign each warehouse to its team, the
QUERY_TAGparameter identifies which process or tool runs each query, and theACCOUNT_USAGEviews, such asWAREHOUSE_METERING_HISTORYorQUERY_ATTRIBUTION_HISTORY, show consumption by warehouse and by query.
-- Databricks: this month's consumption by cost centre
SELECT custom_tags['cost_centre'] AS cost_centre,
       SUM(usage_quantity) AS dbus
FROM system.billing.usage
WHERE usage_date >= date_trunc('MONTH', current_date())
GROUP BY 1
ORDER BY 2 DESC;
With this data, a monthly report by team turns cost into a concrete conversation: this process costs this much, generates this value and could be done another way.
Optimising Queries and Processing
Once compute left running is under control, the next saving lies in the work being done:
- Incremental processing: process only what has changed since the last run, with dbt incremental models, dynamic tables in Snowflake or incremental pipelines in Databricks, instead of recomputing everything every night.
- Physical data layout: clustering or partitioning aligned with the most frequent filters, so that queries read only what they need. These techniques carry their own maintenance cost, so apply them where query volume justifies it.
- Regular review of the most expensive queries: a small number of queries usually accounts for a large share of consumption; reviewing them every month is one of the actions with the best return.
- Realistic refresh frequencies: a dashboard viewed once a day does not need refreshing every five minutes.
FinOps as a Habit, Not a Project
The FinOps Foundation framework proposes three continuous phases: inform, giving visibility of spend to whoever generates it; optimise, acting on the sources of overspend; and operate, turning good practices into automatic rules and regular reviews.
The key lies in the last one. Savings achieved through a one-off project are lost within months if there are no policies to sustain them. That is why cost should be measured in business units, such as cost per report, per pipeline or per active user, and reviewed with each domain's owners just as their results are reviewed.
Is your Databricks or Snowflake bill growing faster than the value you get from it?
At Galde, we do not just build modern data platforms: we make them efficient. We identify where compute goes, apply the policies that curb it automatically and leave your team with the visibility needed to keep the savings in place.

How Galde Can Help Control the Cost of Your Data Platform
Through data platforms, we audit Databricks and Snowflake consumption, redesign workload separation and sizing, and apply cluster policies, resource monitors and incremental processing where they have the most impact. It is the same thinking we apply when choosing between a lakehouse and a data warehouse.
Through data governance, we turn cost tagging into a mandatory policy, linked to the owner of each data product, so that attribution does not depend on each team's goodwill.
And through generative AI, we apply the same discipline to the compute consumed by AI use cases, such as embedding generation or vector search, which tend to grow unchecked if nobody measures them.
Conclusion
Overspend in Databricks and Snowflake is not solved by negotiating prices, but by changing habits: switching off what is not in use, limiting what can be consumed and attributing every cost to whoever generates it. With those three levers turned into automatic rules, the platform stops growing in cost without growing in value, and the conversation with finance moves from justifying the bill to deciding where to invest.
Frequently Asked Questions
What is FinOps on a data platform?
It is the practice of managing cloud cost continuously and jointly across engineering, the business and finance: giving visibility of spend to whoever generates it, optimising the sources of overspend and turning good practices into automatic rules.
What is the most common cause of overspend in Databricks and Snowflake?
Compute left running with no work: interactive clusters without auto-termination and warehouses with long suspension times. It is usually also the first lever, because it is fixed through configuration without touching any process.
What AUTO_SUSPEND time should you use in Snowflake?
It depends on the workload. For batch ETL, a short time is usually appropriate. For BI with frequent queries, suspending too early discards the warehouse cache and pays a 60-second minimum on every start, so it is worth tuning it by measuring the actual usage pattern.
Do budgets stop spending automatically?
It depends on the tool. In Snowflake, resource monitors can suspend warehouses when the quota is reached. Databricks budgets send alerts but do not stop consumption, so they should be combined with cluster policies that limit what can be created.
Where should a data FinOps project start?
With visibility: tag clusters and warehouses by team and build a monthly consumption report by cost centre. With that map in place, the first measures, such as auto-termination, right-sizing or workload separation, prioritise themselves.